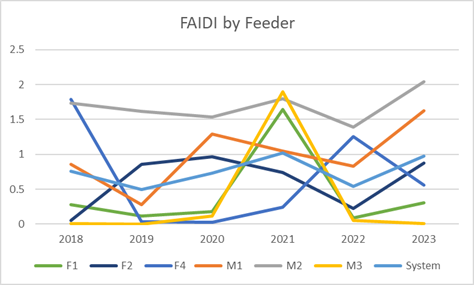
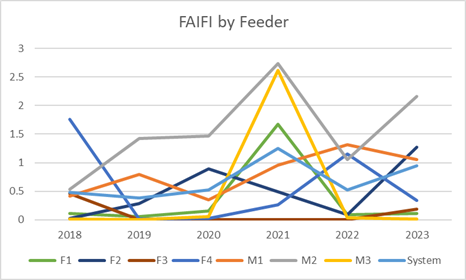
In addition to tracking reliability for all of NOTL, NOTL Hydro also tracks reliability by feeder. The Ontario Energy Board (OEB) is encouraging Local Distribution Companies (LDCs) to track reliability by feeder and NOTL Hydro is one of 27 LDCs (just under half) listed by the OEB of having this capability.
In addition to tracking reliability for all of NOTL, NOTL Hydro also tracks reliability by feeder. The Ontario Energy Board (OEB) is encouraging Local Distribution Companies (LDCs) to track reliability by feeder and NOTL Hydro is one of 27 LDCs (just under half) listed by the OEB of having this capability.
Feeder reliability is a less accurate measure than overall system reliability as the number of customers on a feeder can vary due to switching but it is still a useful measure.
The feeder names will not mean anything to readers outside of NOTL Hydro but can be summarized as serving the following general areas. Feeders starting with an F come from the NOTL Station and feeders starting with an M come from the York Station.
- F1 – Virgil and Niagara Stone Rd up to the Highway
- F2 – Virgil and the Old Town
- F3 – Concession 5 to the former Tweed facility
- F4 – Niagara Parkway and the Old Town
- M1 – St. Davids and Queenston
- M2 – Stewart Rd and Lakeshore Rd.
- M3 – Glendale area including the other side of the Highway
These are generic descriptions of the current configuration. Feeder routes change over time based on changes in the demand for electricity. There are multiple switch points so that the feeder serving particular areas can be changed quite easily; especially as the entire customer base can be served from either station.
The M2 remains the feeder with the worst reliability. The M2 is subject to some of the worst weather in NOTL when the storms come off Lake Ontario, it has some of the last rural infrastructure to be upgraded as part of the voltage conversion plan and it has a high level of tree cover.
This data is continuously analyzed to ensure we understand the performance on the NOTL Hydro system and that the investment plans match the system needs.
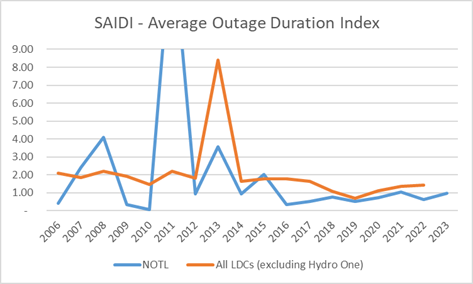
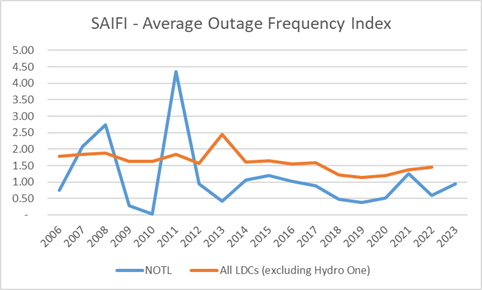
Overall, NOTL Hydro’s performance exceeds the LDC industry average (we do not include Hydro One in the comparison which would only serve to flatter NOTL Hydro) though there are variances from year to year.
The following are actions being taken which help improve reliability on the system and by feeder
- Vegetation management (tree trimming) is an ongoing requirement. It is not always popular but is needed. There is a new contractor performing this work in 2024.
- Smart grid enhancements with new automated switches and reclosures are being installed each year. These can help reduce the extent and duration of outages. Reclosures in particular can help a feeder re-energize if the outage was due to a momentary rather than a sustained contact on the line.
- The renewal and voltage conversion of the infrastructure continues as has been the case for many decades. Continued investments in the existing infrastructure are needed to maintain performance and strengthen the lines. Areas of focus in 2024 will include the Line 1/Line 2/Concession 7 area, some of the firelanes and the Old Town.