Hello again. I took a break after having one blog a week for a year but I will be doing a few more blogs on a more sporadic basis.
Today I would like to discuss the cost of the electricity commodity for the average residential customer. The chart above should be interpreted in the following manner.
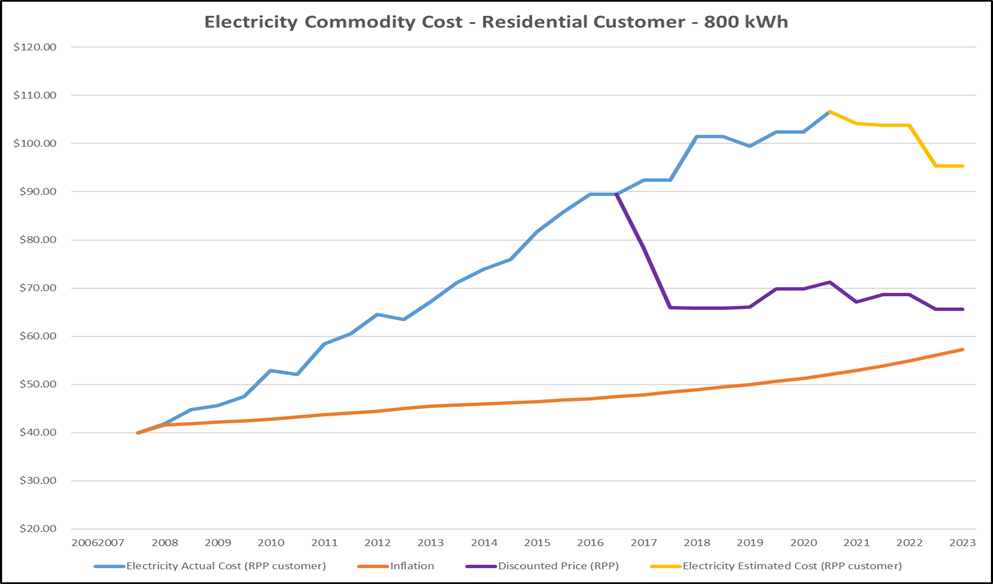
- The blue line is the cost of electricity for residential customers from 2006 to 2016 based on RPP rates. After 2016 and to 2021 it is the actual cost of electricity but not what a residential customer was paying. 2016 is when the Government of Ontario started to subsidize the cost of electricity with a discount that showed up on the bill (Ontario Electricity Rebate – OER) of residential and small business customers. In 2021, the Government of Ontario introduced a second rebate that reduced that actual cost of electricity to the system for all customers. This also meant the actual cost could no longer be determined.
- The purple line is what a residential customer has paid for electricity since 2016 based on RPP and less the OER.
- The yellow line is my estimate of the actual cost of electricity for residential customers since 2021.
- The orange line is what the cost of electricity would have been if it had increased with inflation since 2006 based on the Bank of Canada inflation calculator.
There are a few things to highlight on the chart.
The actual cost of electricity for consumers has been flat for the past six years. The Government of Ontario has promised to keep total electricity cost increases to the rates of inflation. One would therefore expect the cost to increase each year and parallel the orange line. Instead, what is probably happening is that the costs of transmission and IESO services are rising faster than inflation forcing an offsetting lower increase in the electricity commodity cost.
If this keeps up the residential cost of electricity may soon match the inflationary increase since 2006. It is worth noting that the subsidy to keep the residential cost of electricity this low is approaching $7 billion a year.
The yellow line is an estimate but seems to show a declining actual cost of electricity. I think there are two reasons for this.
- This is the actual cost of electricity for residential customers, not the actual cost of the whole system. Residential customers subsidize large industrial customers through an incentive program known as the Industrial Conservation Initiative (ICI) which reduces the cost of the Global Adjustment (GA) for these customers. The GA has been much lower the past couple of years which has reduced the cost of this subsidy.
- The overall demand for electricity has been increasing the past few years. This has lowered the average cost by removing some of the inefficiencies of the Green Energy Act (paying for electricity not being used, cheap exports to the US, etc.).
Both of these are temporary as the GA is higher again in 2023 and increasing demand will eventually lead to higher prices. Then we will see if the electricity subsidy gets higher or if the cost of electricity for residential customers rises. The Government of Ontario is no doubt hoping to keep the costs manageable until 2028 when some of the high-priced Green Energy Act contracts start to expire.